
case study: venice boulevard, mar vista
Former (some would say disgraced) Los Angeles City Councilmember Mike Bonin, the L.A. Department of Transportation (LADOT), and the advocates who push for road diets across L.A. all have said a lot in the past few years to promote and support the road diet on Venice Boulevard. Unfortunately, it turns out that most of what they’ve claimed isn’t true. They have skewed statistics and flat out lied to the community.
Mike Bonin claims there have been fewer accidents…when in reality there have been more.
Mike Bonin claims that business is booming…when in reality the road diet has decimated local businesses - over 30 businesswoman went bankrupt or moved off this 0.8 mile stretch of Venice since the implementation of the road diet….and we're still counting. In the 10 years previous to the road diet only 2 businesses were lost of this same stretch.
LADOT claims that the same number of cars are traveling down Venice Boulevard…when in reality thousands of cars every day divert to residential streets to avoid congestion. And that is not our claim, it’s from LADOTs own traffic volume counts!
LADOT claims traffic flows down Venice Boulevard in the same amount of time as before the road diet, when in reality it takes nearly twice as long to travel this 0.8 mile stretch. Again this data comes straight from LADOT.
Below we examine these claims in detail, and using LADOT’s own data as well as second party data, prove none of them is not true.
In short, Mike Bonin and the LADOT are not being honest with the community. Read more below.
Data from Berkley TIMS tool - a graphical representation of CHP SWITRS data
By California law all police departments must submit traffic accident data to the CHP for inclusion in the Statewide Traffic Reporting System (SWITRS) database.
Prior to the installation of the Venice Boulevard road diet in May of 2017, as well as in the months that followed, Councilmember Mike Bonin and Damien Newton (former editor of StreetsblogLA and board member of the Mar Vista Community Counicl) claimed the road diet was necessary to save lives. They said “Five people died along the one-mile stretch of road, now a focal point of the city’s Great Streets program, in the past decade.”
In order to push their narrative that this stretch of Venice Boulevard is unusually dangerous and that something needed to be done to save lives, they fudged the numbers. In fact, they more than doubled the numbers. According to California Highway Patrol Statewide Integrated Traffic System (SWITRS) database, two people have lost their lives on Venice Blvd between Beethoven and Inglewood in the past 10 years, not five. In fact there haven’t even been five fatalities in the past 15 years; there were four.

CHP Details of all fatal accidents on the ‘Road Diet’ in the past 10 years
Of the four fatalities in the past 15 years, only one was an individual not in a car. The claim that Venice Boulevard isn’t safe for people walking or biking simply isn’t supported by the facts or data.
The lone cyclist fatality occurred on March 2nd, 2008 at 7:55pm. The cyclist was intoxicated and riding west in the east bound lanes. That is not the kind of accident that can be prevented with bike lanes or a road diet.
The second fatality to occur in the past 10 years occurred on January 27th, 2016 at 4:10pm. A car turned left in front of oncoming traffic at a point where there was insufficient time complete the turn. Unfortunately, as we’ve seen in the post road diet data, this type of accident has been common. In other words, rather than making Venice Boulevard safer, the road diet actually has led to more drivers making the mistake that led to the only fatal accident involving someone in a car in the past 10 years.

LADOT’s count of accidents in the 18 months following the installation of the road diet. From LADOT’s project website: https://www.veniceblvdmarvista.org/evaluation
Methodology: All accidents on Venice Blvd between Beethoven and Inglewood are counted.
Venice Blvd Post Road Diet: LESS cars yet MORE accidents and MORE injuries.
On the LADOT’s website they claim the road diet on Venice Blvd has been an unqualified success. One of their claims is Venice is “A Safe Street”. They say “there has been a 14% reduction in overall collisions across the corridor.” But you have to read the fine print…that claim is based on not counting all the accidents that have actually happened on Venice Blvd. The entire quote reads:
“Venice Blvd and Wade Street has seen an increase in left-turn collisions, an anomaly that doesn’t align with trends we are seeing elsewhere on Venice Blvd. Excluding these correctable crashes at Wade Street, there has been a 14% reduction in overall collisions across the corridor.”
In other words, if you don’t count all the accidents there have been less accidents.
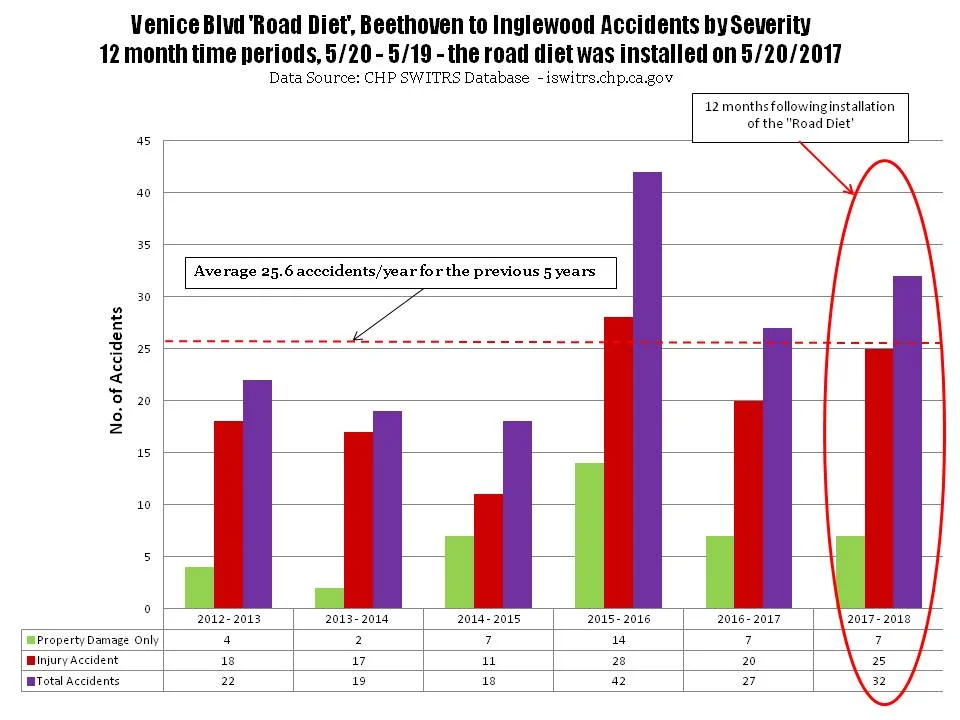
The fact is there have been MORE accidents and MORE injuries in the 12 months following the road diet than the year before. Again we look to the CHP’s SWITRS data to verify LADOT's claim.
In the 12 months following the road diet there more accidents and more injuries than in any year in the previous 5 with the exception of 2016 (an unusually wet year which led to a spike in accidents citywide).
The total number of accidents increased 19%
Injury accidents were up by 25% in the same time period.
Looking back 5 years accidents were 24% higher than the historical average. Injury accidents were up by 33% over the 5 year average.
Looking back 15 years accidents were 12% higher than the historical average. Injury accidents were up by 20% over the 15 year average.
All of this while there has been a 13% drop in traffic volume.
These are the facts about the “safer” Venice Blvd
Speaking of traffic volume LADOT claims that by 12 months after the road diet traffic volume on Venice Blvd is “trending” back to pre road diet levels.

LADOT’s traffic volume and travel time data.
From LADOT’s project website: https://www.veniceblvdmarvista.org/evaluation

The graph they show on their website does indeed show that traffic volume is trending back towards the same numbers as before the road diet. However if you examine the raw data which LADOT provides in a 140 page data appendix it is noted that the last data point, from September 2018, is an average of two days, September 25th and September 26th 2018.
What is odd about this is this last data point is the only one that is an average of two days, all other data points show the count that was measured on a single day.
When each individual data point is graphed it is clear why LADOT chose to average those last two days, September 25th was a completely anomalous data point. For reasons unexplained there were more cars traveling Venice Blvd on September 25th 2018 than any other day measured, and 11,004 more cars than on the very next day. What happened on September 25th 2018? Was there really a jump of 30% in traffic volume that day? Or was there something wrong with LADOT’s equipment? Either way we don’t know because LADOT has refused to answer this question.
Traffic volume hasn’t returned to pre road diet levels, LADOT’s data shows there has been a drop in traffic of between 22% and 13% and all these cars are now on the residential streets that parallel Venice Blvd. Rather than “accommodating vehicle demand” as claimed LADOT’s road diet has forced thousands of commuters to flee to the residential streets to seek relief from the gridlock created by removing 33% of the streets capacity.
At the end of 2018 Mike Bonin claimed that the road diet had led to a boom in local businesses, with sales up by $3 million dollars following the installation of the road diet.
An examination of the actual data in the 140 page data appendix shows that this claim is completely false.
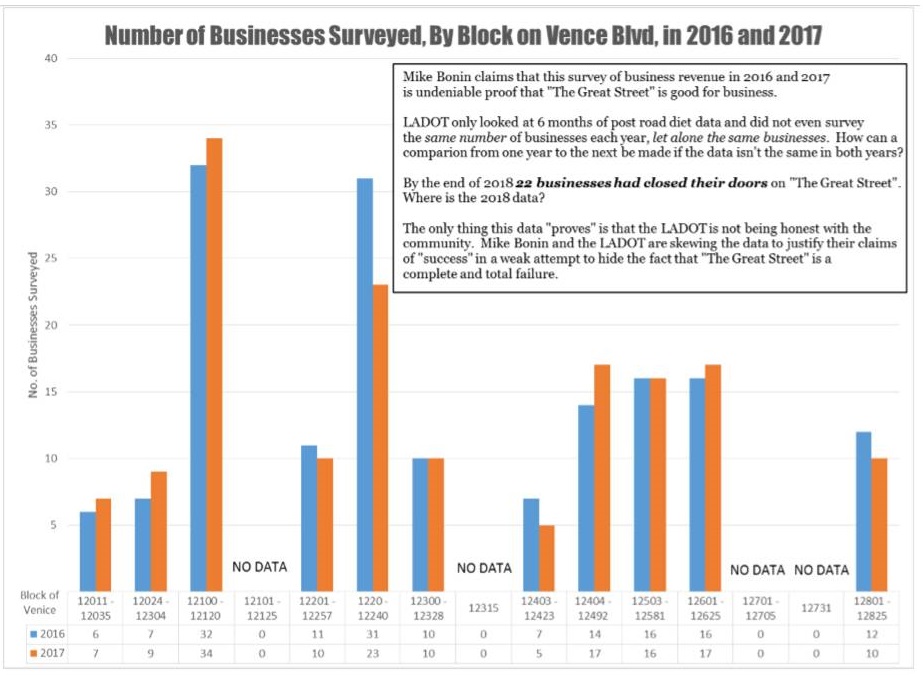
LADOT compared 2016 sales to 2017 sales, well before mounting losses began to force business to close. At the close of 2018, when Mike was claiming success, 21 businesses had closed along the 0.8 mile stretch of Venice Blvd.
So assuming that all businesses report their fiscal year on the calendar year (the probably don’t) at best there was 6 months of “post road diet” sales data analyzed. And since LADOT didn’t even compare the same number, let alone the same businesses from year to year the data statistically meaningless.
This is just another example of Mike Bonin and the LADOT using bad data to hide the truth, the Venice Blvd road diet has been a disaster by every measure.