
“Complete Streets” are often deadly
KeepLAMoving has dived deep into the data, which prove the activists are lying. The video below summarizes that data and shows the impact of “Complete Streets” on public safety, especially emergency response and evacuations.
CLICK BELOW TO SEE MORE. KeepLAMoving has collected videos from AROUND the country exposing the deadly consequences of “complete streets, ESPECIALLY “ROAD DIETS”
Unlike the activists, KeepLAMoving isn’t afraid of contrary arguments. We provide links to reports that activists themselves often cite when claiming a traffic calming or a road diet will result in, among other things, “a 47% reduction in accidents,” “increased business activity,” or “less pollution from traffic.” In fact, the substance of the reports prove the opposite. Read on….
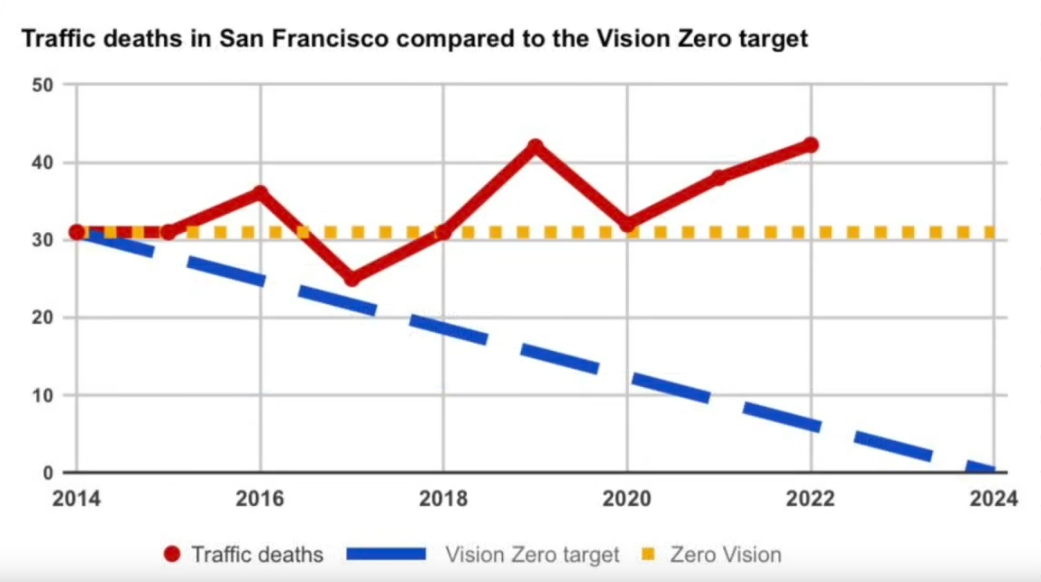
“Complete Streets” (and its companion policy “Vision Zero”) are also killing pedestrians


In Alexandria VA accidents increased by a mind blowing 78% in the first 9 months following a “road diet”!! This mirrors our experiences here and here in LA. And the road diet also impacted emergency response, “A main concern continues to be emergency vehicles having the ability to navigate through a narrower, one-lane road safely.”
DETAILED CASE STUDIES AND DATA
DID YOU THINK WE WERE DONE? BROWSE THE LINKS BELOW FOR IN DEPTH CASE STUDIES AND OTHER INFORMATION ON THE REAL WORLD CONSEQUENCES OF “COMPLETE STREETS” AND “ROAD DIETS.”
This report by the Highway Safety Information System and funded by FHWA seeks to answer the question will a road diet reduce accidents and the severity of accidents, and in doing so debunks the often repeated claim that a road diet will reduce accidents by “19% - 47%”. This report found that when all factors are considered there is virtually no change in crash frequency or severity following a road diet. “The authors point out the flawed approach employed in reports that claim large reductions in accidents following a road diet:
“Some of the case studies reviewed included comparisons of the number of crashes before and after the conversion to a road diet. These comparisons have shown that road diets can reduce the total number and severity of crashes. However, some of these studies had certain limitations. First, only selected intersections and midblock sections were sometimes evaluated, instead of the entire road diet section. Second, no comparisons with non-road diet locations were made in any of the studies cited above. The observed reduction in crashes, therefore, could have been a citywide phenomenon (such as a reduction in crash reporting) and not necessarily the result of installing road diets.”
“Twelve road diets and 25 comparison sites in California and Washington cities were analyzed. Crash data were obtained for these road diet (2,068 crashes) and comparison sites (8,556 crashes). A “before” and “after” analysis using a “yoked comparison” study design found that the percent of road diet crashes occurring during the “after” period was about 6% lower than that of the matched comparison sites. However, a separate analysis in which a negative binomial model was used to control for possible differential changes in average daily traffic, study period, and other factors indicated no significant treatment effect. Crash severity was virtually the same at road diets and comparison sites.”
An often overlooked and rarely discussed byproduct of a road diet is its impact on emergency response times. When traffic backs up due to the loss of a travel lane, and the barriers which are often put in place to create protected bike lanes prevent cars from “moving right” to make way emergency response times are greatly impacted. This study by then Assistant Fire Chief for the city of Austin Texas, Leslie Bunte, concludes that for every life saved due to “traffic calming” 37 lives will be lost due to the increased emergency response times caused by traffic calming. It’s important to note that his analysis only studied emergency response times for victims of sudden cardiac arrest in the city of Austin. When all time critical emergencies are considered, and the population numbers scaled to larger cities, the ratio of lives lost for every life saved is even greater.
“Again, based on this analytical comparison, one can easily determine that there is a much greater risk for installing traffic calming devices compared to the benefit for a policy or program that provides a reduction in emergency vehicle response times. In essence, Austin has adopted a public policy program that loses 37 lives (SCA) for every one life saved (pedestrian).”
Visit our videos page to see frightening examples how road diets negatively impact emergency response times.
Another often made claim is that a road diet will be good for business. However we have never seen this to be the case. In Playa del Rey, Mar Vista, Seattle, Phoenix and Denver business districts have been decimated by road diets. An often cited report to support the claim that a road diet is good for business is the Los Angels County Bike Coalition’s York Blvd report.
If you read through this study you’ll see that it is a highly tailored “research project” that attempts to prove a forgone conclusion, that road diets are good for business. By skewing the data that is presented, and outright ignoring pertinent data the could change the results the authors conclude that the “dieted” section of York Blvd saw an upswing in business post road diet even though the “non-dieted” section directly adjacent saw a 64% greater increase in business.
Listed below are just a few examples that demonstrate how the author manipulates the data to support his pre-determined conclusions:
1) The comparison of road diet to non-road diet traffic data (on page 7). Why did the author quote daily automobile usage from two different periods? Data for the road diet portion was collected on a Thursday in June 2009. Data for the non-road diet portion was collected on a Tuesday in October 2010. Not only could the population have shifted in that timeframe, but driving behaviors change seasonally, and traffic volumes vary by day of the week.
2) Rather than using objective measurements of success the author asks respondents for their "perception" of economic benefits and presents that as objective measurement of success (page 15). What's worse, the authors didn't use appropriate survey methodology, which should have been used for a survey of the exact same businesses and customers on that section of York Blvd BEFORE the diet and then AFTER, to test if their perceptions changed. Moreover, any survey on this issue should have been anonymous. There's simply too much social pressure to answer in favor of bike lanes.
3) The sales tax analysis has several flaws, including: comparing revenues from two different retail mixes, with different levels of data reporting, with no adjustment for how prices may have changed. Sales tax revenues are as much a function of how much people buy as they are the price of whatever they're buying. e-Commerce is another factor that grew sharply during this period, and which introduces additional "noise" to any comparison.
4 The "Hedonic price model" is also flawed, because the author(s) admit to dropping any variables that they didn't think were significant, a major red flag. Even after that statistical slight of hand, the analysis still shows no impact on property values. But the reader must to take the author's word for it, because full results aren't included in the report
York blvd - The economics of a road diet
This report completed by the Michigan DOT in 2012 concludes that roads with daily traffic volumes greater than 10,000 cars per day should not be candidates for a road diet. This is 1/2 the traffic volume recommend by the NHTSA.
“The results of the operational analysis support a guideline that suggests that 4-to-3 lane conversions result in significant delay when average daily traffic (ADT) exceeds 10,000 and, more importantly, when peak hour volumes exceed 1,000.”
This case study compiled by the FHWA here concluded that a road diet led to a 20% increase in emissions following a road diet.
The complete case study report can be found here.
This report by San Jose State University and published by the Mineta Transportation Institute This report analyzes traffic impacts from the 2015 implementation of a pilot “road diet” on Lincoln Avenue, in the City of San Jose, California, comparing data on traffic volumes and speeds from before and after the road diet was implemented. The analysis looks at impacts on both the road diet location itself and on surrounding streets likely to have been impacted by traffic diverted off the road diet segment. Individual locations, particularly among the neighborhood streets, saw more noticeable negative impacts.
“Another parallel route which is a less desirable alternative from a traffic planning perspective as it is a single-lane, residential street with a 25 mph speed limit is Camino Ramon/Hicks Avenue (locations 21, 27, & 28).[Morning] peak period hourly traffic increased 11% for Camino Ramon and 13% for location 27 along Hicks Avenue.”